|
Materials and Methods
Study Area: Select Lakes in Vrishabhavathi Valley (V Valley), Greater BangaloreGreater Bangalore (12o49’5’’N to 13o08’32”N latitude and 77o27’29”E to 77o47’2”E longitude), covers an area of 741 square kilometers. The district is located at an altitude of 920 m above mean sea level, delineating three watersheds, namely Koramangala and Challaghatta Valley (K and C Valley), Vrishabhavathi Valley (V Valley), and Hebbal Valley (H Valley). Due to the undulating terrain, a large number of tanks were created by the earlier rulers in Bangalore that provide water for various uses like drinking, irrigation, washing,fishing, etc. The mean annual rainfall in Bangalore is 880 mm, with 60 rainy days a year over a decade. The summer temperature ranges from 18oC - 38oC while the winter temperature ranges from 12oC - 25oC (Ramachandra and Aithal, 2015).Vrishabhavathi valley has a catchment area of ~170 square kilometers that covers 97 wards of Bengaluru. Vrishabhavathi river had numerous interconnected lake systems such as Kempambudilake in Basavanagudi, Sankey lake in Sadashivnagar, Yediyurkerein Yediyur, etc. (Ramachandra et al., 2017). The present study involves field survey, physico-chemical analysis, and recording phytoplankton diversity of 15lakes in Vrishabhavathi Valley (V Valley) of Greater Bangalore (Figure 10.1).
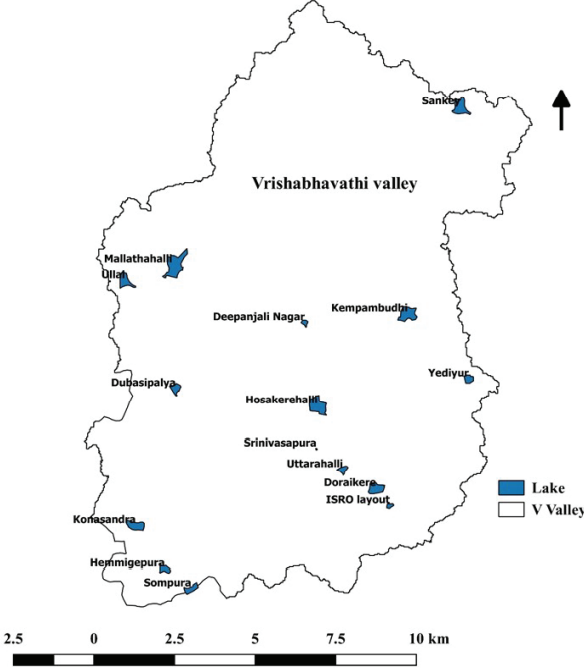
Water Quality Analyses of LakesWater samples were collected from 15 lakes in Vrishabhavathi valley for physico-chemical analysis during 2017 - 2018. The physico-chemical parameters analyzed include water temperature (WT), total dissolved solids (TDS), electrical conductivity (EC), dissolved oxygen (DO), pH, chloride (Cl), total alkalinity (TA),total Figure 10.1: Lakes of Vrishabhavathi Valley, Greater Bangalore, Karnataka, India. hardness (TH), calcium (Ca), magnesium (Mg), biochemical oxygen demand (BOD), chemical oxygen demand (COD), nitrate (N) and ortho-phosphate (OP). The on site parameters include water temperature, pH, dissolved oxygen, total dissolved solids, and electrical conductivity measured using a portable meter (Extech). The turbidity was measured with a hand-held Turbidometer (Hach). The water samples collected from monitored lakes in clean and sterile polypropylene bottles were transported to the laboratory for further chemical and nutrient analysis using standard methods (APHA, 2005), and experiments were carried out in triplicates. QGIS open-source GIS software was used for generating maps of various physico- chemical parameters of 15 lakes in the Vrishabhavathi valley of Greater Bangalore. Phytoplankton Sampling and AnalysesPlanktons were collected by filtering 50 liters of water from the lake surface using a plankton net. Phytoplankton samples were fixed with 4 per cent Lugol iodine solution and concentrated to 50 mL. Then, the samples were stored in labeled plastic bottles and transported to the laboratory for taxonomic analysis. Phytoplankton samples were identified according to the standard keys (Desikachary, 1959; Prescott, 1970; AlgaeBase, 2021)and enumerated with an optical microscope at 10 X and 40 X magnifications. Generally, three subsamples were counted for each lake sample. The maps depicting phytoplankton diversity of 15 lakes in Vrishabhavathi valley were created using QGIS open-source GIS software. Data AnalysisStatistical analyses were carried out using PAST3 software. Pearson correlation analysis was carried out to evaluate the correlation between phytoplankton abundance and water quality parameters. Then, multivariate statistical analysis of the water quality data set and phytoplankton was performed through (CCA) to understand the relationship between water quality parameters and phytoplankton distribution as well as the composition of the monitored lakes. In this study, the Shannon-Wiener index, Simpson index, Pielou Evenness index, Berger and Parker index, Margalef Diversity index, and Menhinick index were used to evaluate the phytoplankton structure lakes. Various diversity measures such as the Shannon– Wiener index (H´), Evenness (J´), Simpson index (Ds), richness (S), and Berger and Parker index (Db) can be used to estimate the phytoplankton diversity (Zhang et al., 2016).
|